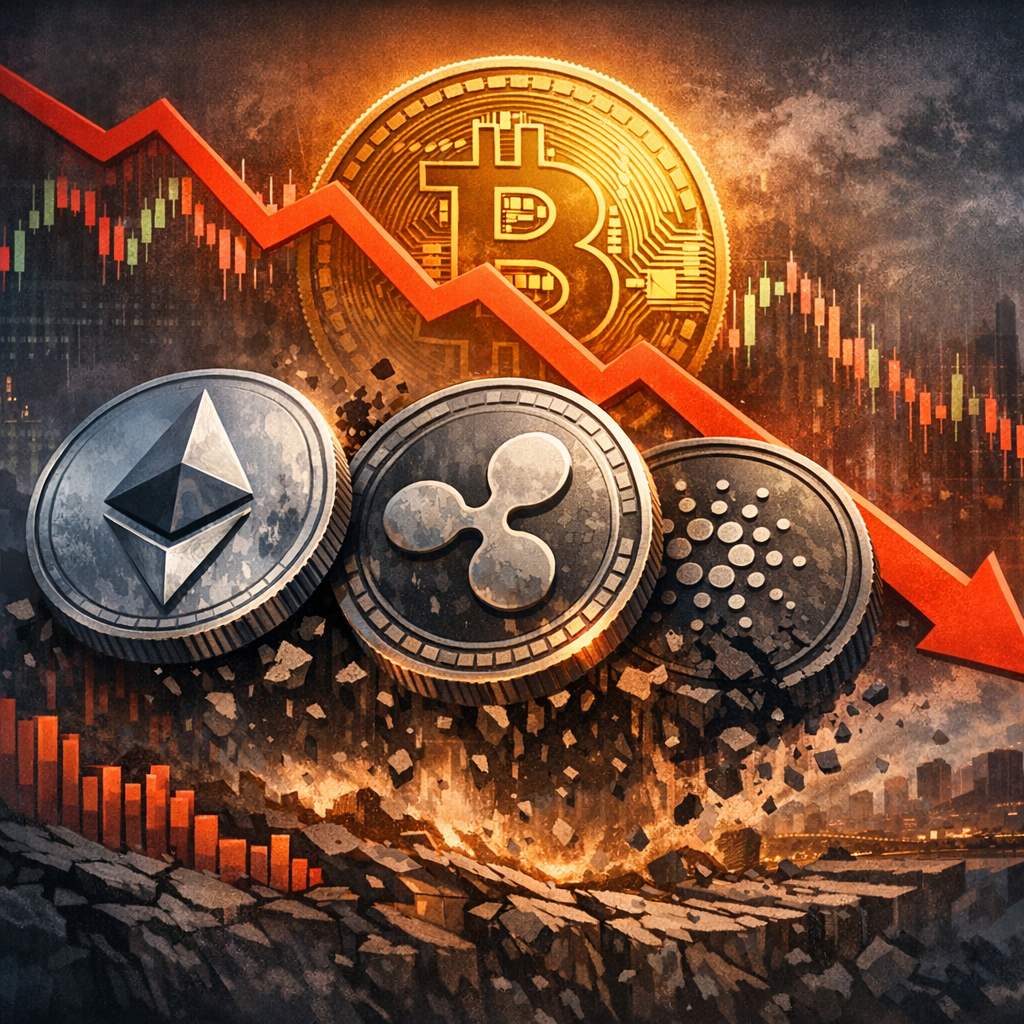
Altcoin Performance Through a Bitcoin Lens
For years, crypto investors have waited for the elusive “alt season”—that explosive period when alternative cryptocurrencies (alts) outperform Bitcoin across the board. Yet, in the most recent Bitcoin rally, something unusual happened: Bitcoin surged, but many of the largest altcoins quietly lagged behind. In fact, several well-known projects are now trading at their lowest values ever when measured against Bitcoin.
This trend raises an important question: what does it really mean when an altcoin hits an all-time low (ATL) against BTC—and why does it matter for investors?
In this article, we’ll explore how to interpret Alt/BTC charts, examine notable projects currently at or near their lowest relative valuations, and unpack the broader trend affecting many of the top cryptocurrencies today.
Understanding Relative Value in Alt/BTC Charts
Most investors are used to evaluating crypto assets in USD terms. If a coin goes from $5 to $10, that feels like a win. But this perspective can be misleading, especially in a market where Bitcoin acts as the benchmark asset.
An Alt/BTC chart measures how an altcoin performs relative to Bitcoin rather than the dollar. In simple terms, it answers the question: would you have been better off holding Bitcoin instead?
When an altcoin hits an all-time low against BTC, it means that—even if its USD price hasn’t collapsed—it has underperformed Bitcoin more than ever before. For long-term holders, this can represent a significant opportunity cost.
For example, if an investor held Polkadot or Uniswap during Bitcoin’s latest run, they may have seen modest USD gains or even stability. However, compared to simply holding BTC, their relative value has declined sharply.
A helpful visual aid here would be a side-by-side comparison chart showing USD vs BTC performance for a few major altcoins.
Altcoins at Historic Lows Against Bitcoin
Several high-profile projects—many of them leaders during the 2021 bull market—are now sitting at or near their lowest valuations against BTC.
Polkadot, once hailed as a next-generation interoperability solution, has steadily declined in BTC terms. Even when ignoring short-term volatility like flash crashes, its long-term trend continues downward.
Uniswap, one of the most successful decentralized exchanges ever built, tells a similar story. Despite strong brand recognition and continued usage, its token has struggled—possibly due to increased competition from newer decentralized trading platforms, including perpetual futures exchanges.
Other notable examples include:
Near Protocol and Aptos, both positioned as high-performance Layer 1 blockchains, have seen persistent relative declines despite ongoing development.
Arbitrum, a leading Ethereum Layer 2 solution, has not escaped the trend either. Even with strong adoption metrics, its token performance against BTC has weakened.
Algorand and Cosmos (Atom), once praised for their technology and ecosystems, continue to slip further relative to Bitcoin, with no clear reversal in sight.
Filecoin and Flare show similar patterns, with long-term charts that resemble a gradual bleed rather than cyclical recovery.
Even Avalanche, which hasn’t quite reached its lowest point, is approaching levels not seen since shortly after its launch.
Including a series of annotated charts here—highlighting ATL points and long-term downtrends—would help readers visually grasp the magnitude of these declines.
What’s Driving Altcoin Underperformance
The pattern isn’t random. In fact, a closer look reveals a clear trend: many of the worst-performing assets are Layer 1 blockchains competing for similar use cases.
During the 2021 cycle, the market rewarded narrative-driven growth. New chains promised faster speeds, lower fees, and better scalability. Capital flowed into multiple competing ecosystems simultaneously.
Today, the environment has shifted. Several factors are contributing to altcoin underperformance:
First, capital concentration. Investors are increasingly consolidating into Bitcoin, especially as institutional adoption grows. Bitcoin is viewed as the “safest” crypto asset, drawing liquidity away from riskier alternatives.
Second, dilution. Many altcoins have ongoing token emissions, unlock schedules, or inflationary models. Even if demand remains steady, increasing supply can push prices down relative to BTC.
Third, competition saturation. The Layer 1 space is crowded. Instead of one dominant alternative, there are dozens, each splitting user activity and developer attention.
Finally, shifting narratives. New sectors—such as AI tokens, real-world assets, or memecoins—often attract speculative capital, leaving older projects behind.
A timeline infographic showing shifting crypto narratives over time would be especially useful in this section.
Evaluating Opportunity vs. Risk in Altcoins
It’s tempting to view ATL levels as buying opportunities. After all, if something is at its lowest point, shouldn’t it be due for a rebound?
Not necessarily.
An altcoin hitting an ATL against BTC is not inherently bullish. It can reflect deeper structural issues, such as declining relevance, weak tokenomics, or fading market interest.
There are historical examples of coins that never recovered relative to Bitcoin, even after multiple market cycles.
However, context matters. Some projects may still be fundamentally strong but temporarily out of favor. Others may benefit from future narrative shifts or technological breakthroughs.
The key is distinguishing between temporary underperformance and long-term decline—a task that requires careful research, not just chart analysis.
Smarter Strategies for Navigating the Altcoin Market
For investors trying to make sense of this environment, a few practical strategies can help reduce risk and improve decision-making.
Start by benchmarking performance against Bitcoin, not just USD. This provides a clearer picture of opportunity cost.
Pay attention to token supply dynamics. Projects with high inflation or large upcoming unlocks often face sustained selling pressure.
Diversify cautiously. Owning multiple Layer 1 tokens may not provide true diversification if they all follow similar trends.
Focus on usage and adoption metrics rather than hype. Active users, transaction volume, and developer activity can offer better signals than price alone.
Consider phased entry strategies. Instead of buying all at once, spreading purchases over time can reduce the impact of continued downtrends.
A checklist-style infographic summarizing these tips would be helpful for readers looking to apply them عملي.
A Changing Landscape for Crypto Investors
The current state of altcoins presents a sobering reality: not all crypto assets rise together, even during a broader bull market. While Bitcoin continues to strengthen its position, many altcoins—especially those from the 2021 cycle—are struggling to maintain relevance in BTC terms.
Understanding Alt/BTC charts offers a more complete picture of performance and highlights the importance of opportunity cost in crypto investing.
Rather than assuming every dip is a buying opportunity, investors should approach altcoins with a critical eye, focusing on fundamentals, market trends, and long-term viability.
The next alt season may still come—but if it does, it’s unlikely to lift all boats equally.
References and Further Reading
For readers who want to explore this topic further, consider reviewing:
Bitcoin dominance charts and historical cycle analysis on platforms like TradingView.
Tokenomics breakdowns from project whitepapers and analytics platforms such as Messari or Token Terminal.
On-chain data from Glassnode or CryptoQuant to understand capital flows within the crypto market.
Research reports from firms like CoinShares, Delphi Digital, or Ark Invest for macro-level insights.
Staying informed through reliable data sources can help investors navigate an increasingly complex crypto landscape with greater confidence.